Software optimization is a key aspect of software development, especially when working with large datasets. The only way to know if your software will perform adequately under ideal (and non-ideal) circumstances is to use a careful combination of tests and benchmarking/code profiling tools. Code profilers show how a software behaves and what functions are being called while benchmarking tools generally focus on just execution time. Some tools combine both profiling and benchmarking. In R, some of the common tools to help with this are microbenchmark, tictoc, Rprof (from R utils package), proftools, and profvis. All of the R based tools have limitations with respect to insight into performance of compiled code: visibility stops at the .Call() function. In order to get around this limitation, the use of a more general purpose profiling tool is required.
While there are many options for profiling C/C++ (or other compiled code) on Linux, many of those tools are difficult to get working correctly with R. Non-Linux users and developers may not be familiar with tools available on their respective platforms. Furthermore, profiling R code with C++ is complicated due to different settings between various OSes. While there are some blog posts and presentation materials available on the Internet, many miss important steps that take some effort to determine the correct solution to resolve.
Steps to profile C++ code being called by R code using a GUI
macOS users can use Xcode (freely available) for profiling of R code that calls C++ code. As Xcode has a nice GUI, it may be the preferred tool for many users. The primary profiling tool in Xcode is called Instruments. Instruments can be launched by first opening Xcode, then from the Xcode application menu select Open Developer Tool->Instruments.
For users on Windows, the GPL licensed Very Sleepy is an excellent GUI profiler that works almost identically to Xcode Instruments for CPU Profiling.
For simplicity sake, steps below demonstrate using Instruments; for other GUIs, steps are very similar. Here are some basic steps to get it working:
- Configure compilation to enable debugging. In GCC and CLANG this can be accomplished by adding ‘-g’ to your compiler flags via Makevars. If you are developing a package, Makevars or Makevars.win should be in the “src” directory. Otherwise, update/check ~/.R/Makevars (linux and mac) or .R/Makevars.win (windows) file in your home directory. Depending on your other compiler settings you may also want to add -O0, though changing optimization levels may alter any gains achieved through profiling.
- Determine what you want to profile. The code you run needs to last sufficiently long to allow for application switching and to gather sufficient data via profiling.
- Create a script to run the code you are interested in. Here is an example of running PCCC with an input dataset of 500000 rows:
library(pccc) # replicate sample dataset from pccc package to get larger set # so that it will run long enough to profile. adjust as needed... mydata <- pccc::pccc_icd10_dataset large_dataset <- mydata[rep(seq_len(nrow(mydata)), 500), ] # function that does work to be profiled ccc(large_dataset[, c(1:21)], # get id, dx, and pc columns id = id, dx_cols = dplyr::starts_with("dx"), pc_cols = dplyr::starts_with("pc"), icdv = 10) - Prep Instruments by selecting ‘Time Profiler’ and then identifying the necessary process. If running script via RStudio, you will need to observe the rsession process. If running via command line R, the process is R. Alternatively run Instruments with “Allocations” to see memory allocations
- Start profiling.
- Start your script in whatever fashion you normally run R scripts.
- After you have gathered sufficient data (perhaps 30 seconds to 1 minute), stop the profiling process.
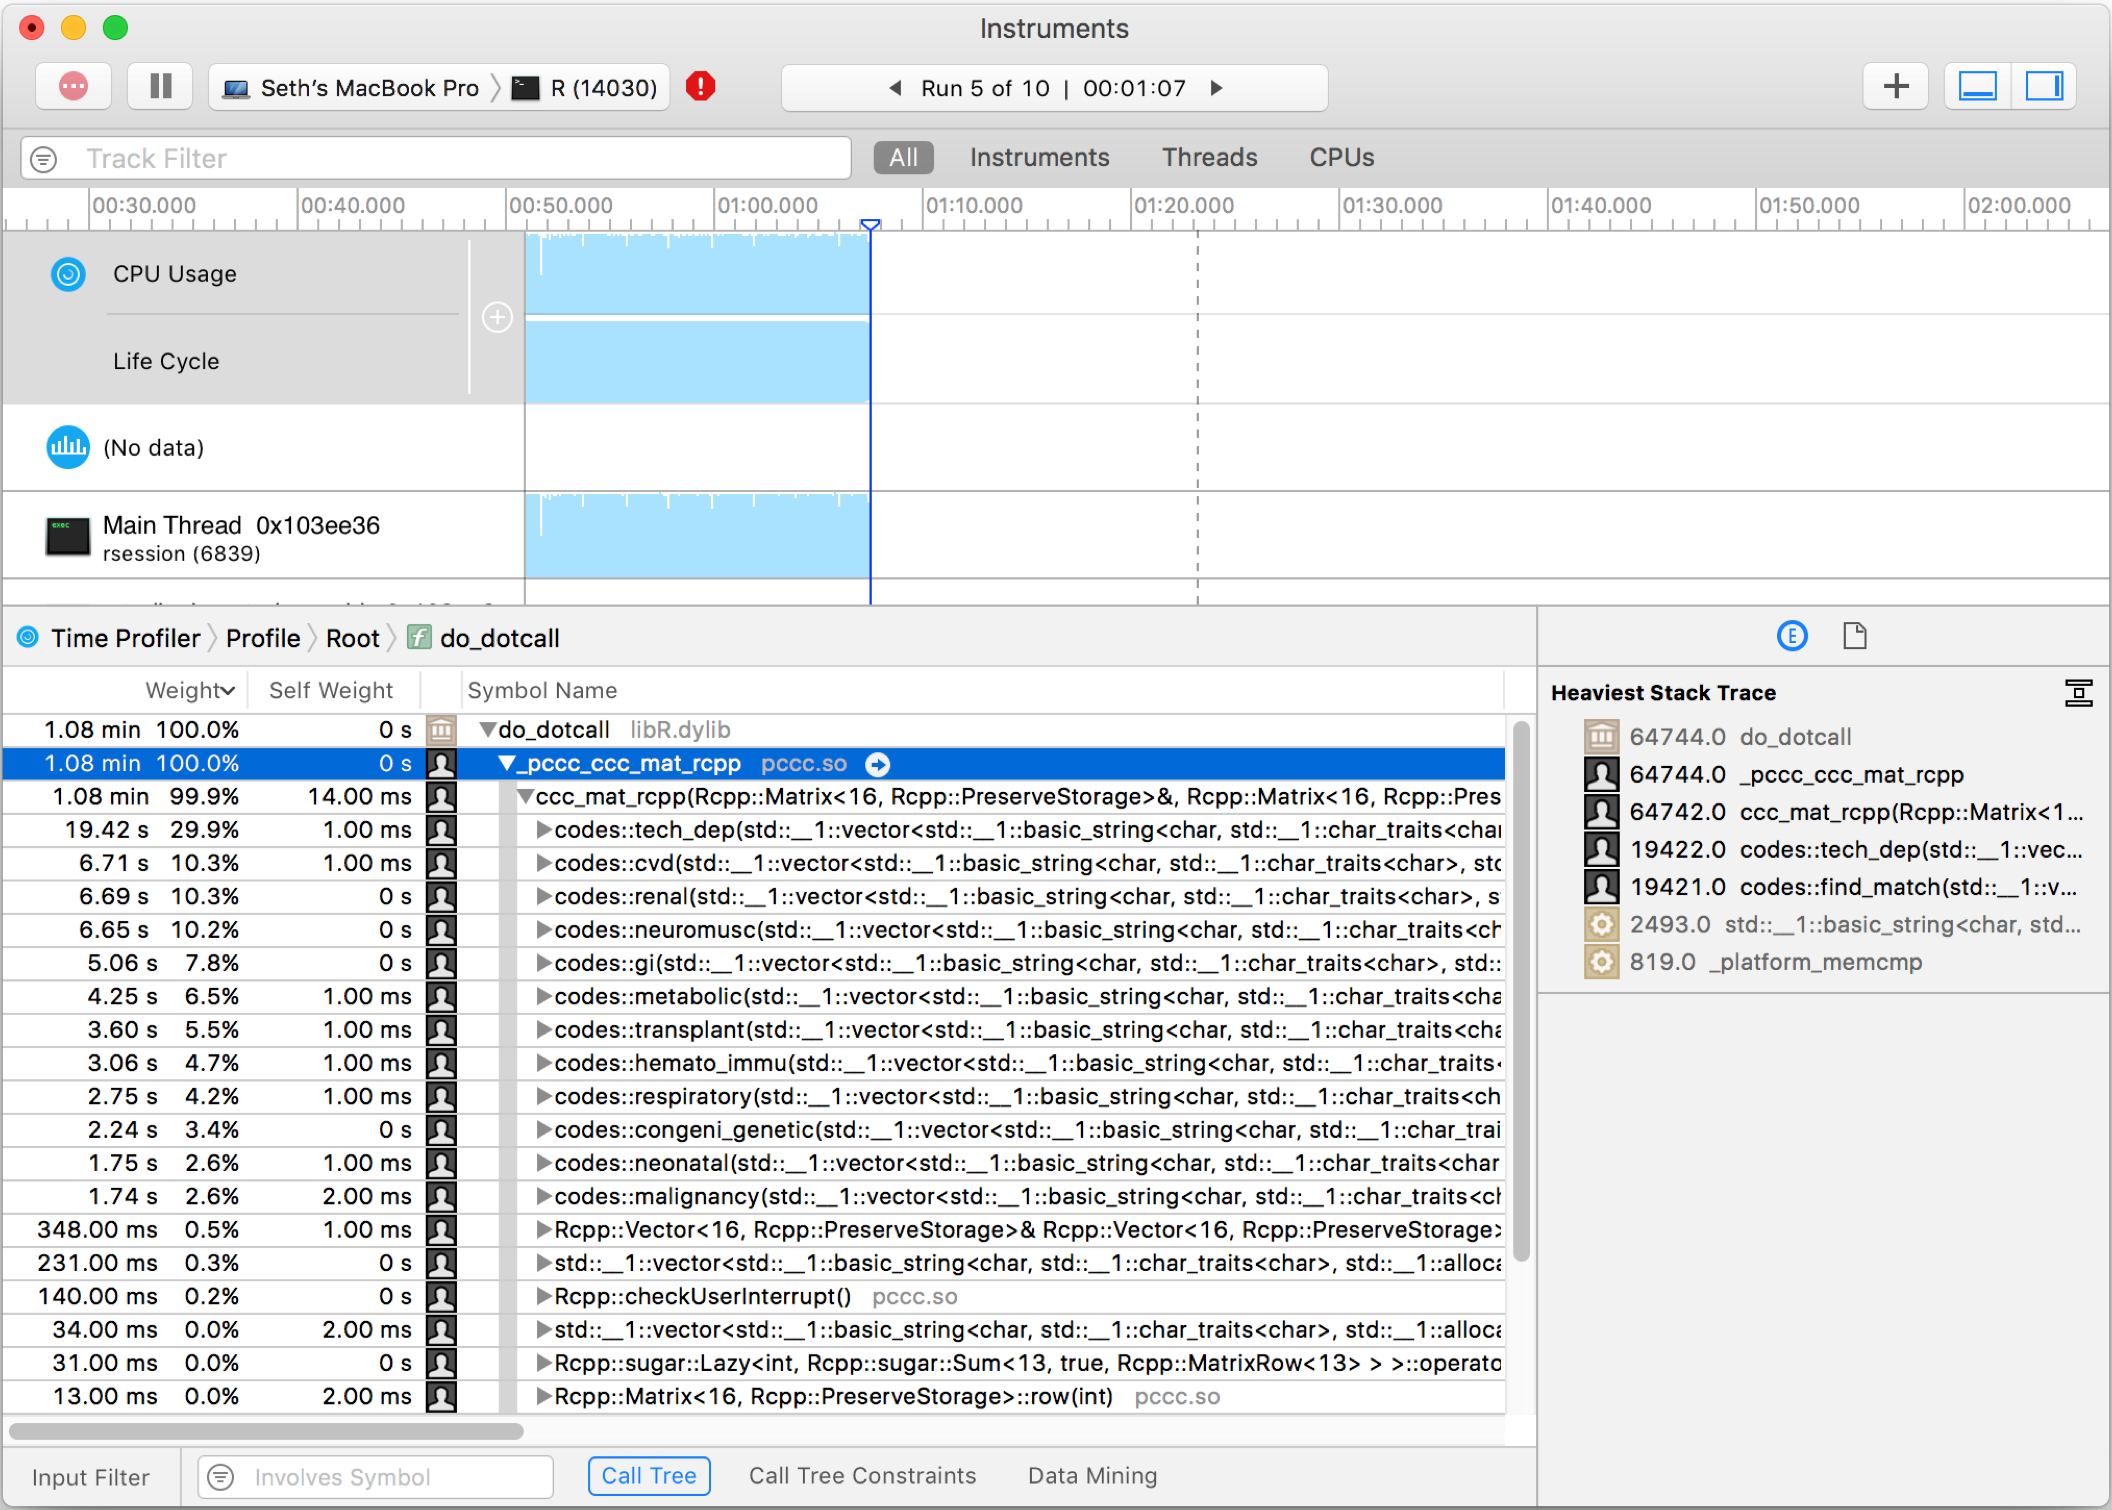
- Find your custom function calls in the symbol tree. There will likely be many layers before your code is called. The call just before your code will be “do_dotcall” The symbol tree should show your custom function names and how long each took.
Xcode Instruments screenshot showing C++ code from PCCC R package
Steps to profile C++ code via command line on macOS and Linux using gperftools
To profile R code that calls C++ code via command line tools requires calling the correct R binary as well as setting up correct environment variables in a OS specific fashion.
For macOS, I recommend installing gperftools via Homebrew brew install gperftools. For Linux, use your respective package manager (rpm/apt/pacman/etc.):
# Debian derivatives
sudo apt-get install google-perftools
# Redhat derivates
sudo yum install gperftools
-
Follow steps 1 – 3 as shown above.
-
Identify location of R binary. By default ‘R’ is actually a batch shell script that launches the R binary. You cannot get the desired profiling informaiton about your code from profiling a shell script.
- For macOS, using R installed via Homebrew, the actual R binary is located at
/usr/local/Cellar/r/3.5.1/lib/R/bin/exec/R - For Linux users, the R binary is likely located at
/usr/lib/R/bin/exec/R
- For macOS, using R installed via Homebrew, the actual R binary is located at
-
Set (or verify) your R_HOME environment variable.
- For macOS, using R installed via Homebrew, the R_HOME is
/usr/local/Cellar/r/3.5.1/lib/R - For Linux users, the R binary is likely located at
/usr/lib/R/bin/exec/R
If your environment variable is not set, set R_HOME via a command like (replace path with your actual R Home location). If you use bash, the command is:
export R_HOME=/usr/lib/R/bin/exec/R - For macOS, using R installed via Homebrew, the R_HOME is
-
Run your test (in this example it is called profile_sample.R) script with the perftools libraries loaded and an environment variable CPUPROFILE that specifies the location to save the CPU profile output. Replace libprofiler path and file name with your actual filename. Replace R binary with your actual R binary with full path.
-
For macOS, this is accomplished via the command
DYLD_INSERT_LIBRARIES=/usr/local/lib/libprofiler.dylib CPUPROFILE=sample.profile /usr/local/Cellar/r/3.5.1/lib/R/bin/exec/R -f profile_sample.R -
For Linux, this is accomplished via the command
LD_PRELOAD=/usr/lib/libprofiler.so CPUPROFILE=sample.profile /usr/lib/R/bin/exec/R -f profile_sample.R
-
-
View the results via pprof; again, ensure you use your actual R binary path.
- For macOS, this is accomplished via the command
pprof --text /usr/local/Cellar/r/3.5.1/lib/R/bin/exec/R sample.profile - For Linux, this is accomplished via (Debian based distributions may call pprof ‘google-pprof’) the command
pprof --text /usr/bin/R ./sample.profile
Output will be something similar to the following:
Using local file /usr/bin/R. Using local file ./sample.profile. Total: 7399 samples 2252 30.4% 30.4% 2252 30.4% __nss_passwd_lookup 2172 29.4% 59.8% 4389 59.3% std::__cxx11::basic_string::compare 982 13.3% 73.1% 5594 75.6% codes::find_match 591 8.0% 81.1% 621 8.4% Rf_mkCharLenCE 462 6.2% 87.3% 482 6.5% R_BadLongVector 223 3.0% 90.3% 223 3.0% std::vector::operator[] (inline) 151 2.0% 92.4% 151 2.0% std::__once_callable 98 1.3% 93.7% 98 1.3% SET_STRING_ELT 83 1.1% 94.8% 83 1.1% _init@6750 30 0.4% 95.2% 452 6.1% Rf_allocVector3 - For macOS, this is accomplished via the command
Updated Oct 6, 2018 based on feedback from Matthew Krump
- Changed code example to be more easily reproduced
- More details on Makevars
- More details on launching Instruments
- Recommendations on installing gproftools